Why Growers Should Compare Time Historical Periods
I often introspect by looking back in time and trying to recall what was I doing during this time last year or 2 years ago or before that.
It helps me in understanding how far I have come, how much I have learned, where I still need to improve if there are any major changes required in my lifestyle, and so on.
Value of Comparing to Historical Time Periods
Similarly comparing any metric over different time periods helps in evaluating a company’s performance by comparing this year’s data with the previous year’s. It will help you in understanding if the actual vs planned production and sales has reasonable fluctuations this year as compared to the same period last year.
Year over year comparison of data also highlights if there are certain patterns that can help you in making better-educated decisions.
Types of Calendar Years Used in Time Period Comparison
As simple as it sounds, the same period last year comparison can be challenging as for weekly comparisons a particular date can fall in different date brackets for 2 different years. In other words, the same day this year is not always the same calendar date due to calendar differences and due to different types of calendars.
A few generally practiced accounting calendar periods are:
Calendar YearFiscal Year4-4-5 Year12 months year starting from Jan 1 and ending Dec 31.12 months year where start and end dates are dependent on business12 months calendar which is divided in quarters each quarter with 13 weeks each; two 4 weeks and one 5 week
Difficulty of Time Period Comparison
The 4-4-5 year calendar is mostly used by retail businesses. Here the data visualization tool, Power BI, proves to be really helpful in aligning different dates as you have the ability to use the desired calendar structure for a fair comparison of data.
Typical Comparison Periods
At Advanced Grower Solutions, we make sure to take care of these data problems leading to simplified comparison across a broad variety of KPIs for this year and past ‘n’ years like:
- Year to date (YTD) – Time period from the first day of the current calendar year to the current date
- Month to date (MTD) – Time period from the first day of the current calendar month to the current date
- Quarter to date (QTD) – Time period from the first day of the quarter to the current date
- Week to date (WTD) – Time period from first day of the current week to the current date
Benefits of Time Period Comparison Analysis
This analysis has proven to improve decision making, leading to benefits not just for one but all our clients in terms of optimizing operation’s time, Raw Material handling, Labor allocation, defining seasonality and trends, Scrap management, etc.
Example Display for Period Comparison
The screenshot displayed below is an example from the Sales report displaying Current and last year’s data across various time periods. The user is provided with different filters to slice the data around.
We believe data visualization tools like Power BI when used optimally, can facilitate important growth factors using reporting abilities for Sales, Production, Forecasting and even Labor budgeting.
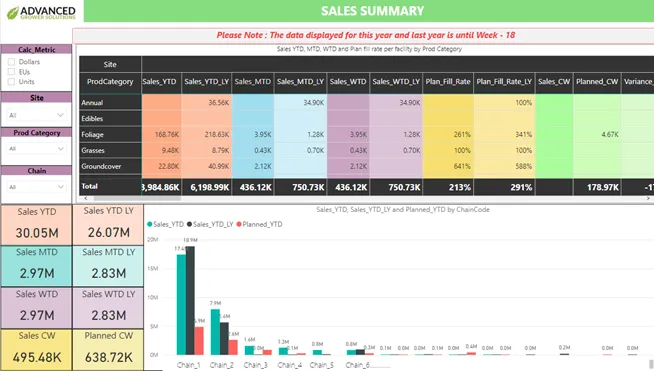
Example Dashboard showing some tabular period comparisons Copyright Advanced Grower Solutions
Bottom Line
Advanced Grower Solutions has extensive experience in building these dashboards and data sets. Contact us today to help you improve your data comparisons.