How And Why Growers Should Calculate Price Increases When Costs Change?
Product pricing.
How do you do it?
How do you make sure your business gets a profit and provides value to the customer?
And, more urgently, how do you deal with rapidly escalating costs in terms of your pricing?
Bad pricing will destroy your margin or your demand.
Not everyone knows the mechanics of the price calculating process in the face of increasing costs. So, let’s look at using industry cost increase data and see how that impacts our profits and pricing.
Raw Material Cost Increases The Grower Industry Reported
According to the Nursery Management in their State of the Industry report for 2022 raw materials prices increased significantly in 2022 with containers leading the way at +27%.
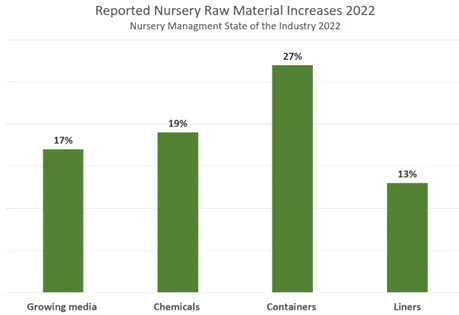
Data from Survey Copyright Advanced Grower Solutions
Certainly, this creates challenges for growers who must manage the supply chain cost increases and also manage their pricing to continue to be profitable.
Also included in their state of the industry report was the percentage of growers who raised and who didn’t raise prices in 2022 relative to 2021.
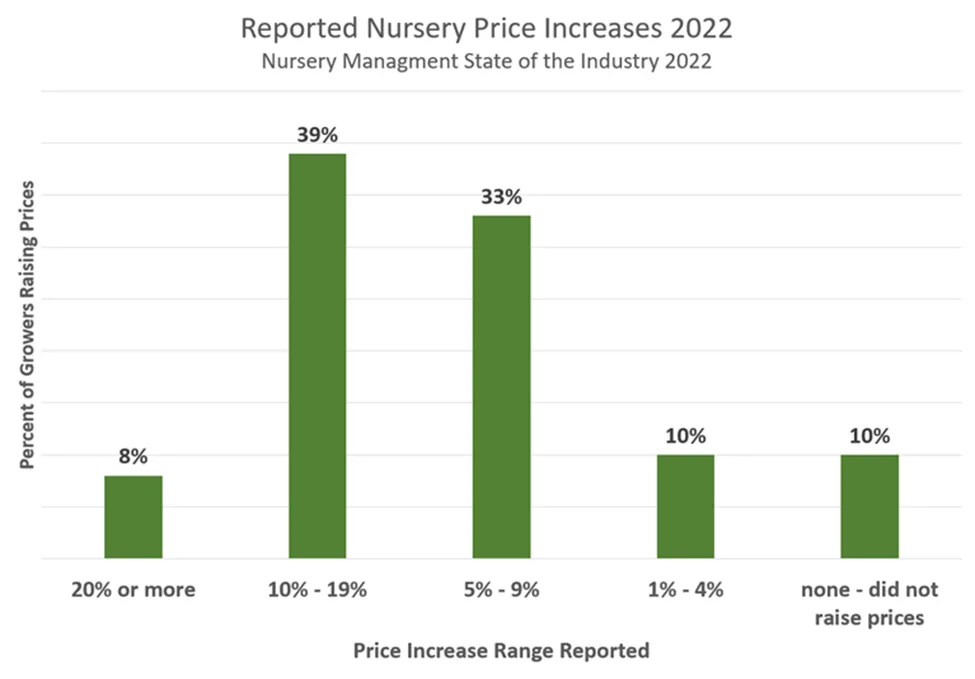
Data from Survey Copyright Advanced Grower Solutions
This shows that some growers didn’t raise prices at all or very little. This amazed me in the wake of raw material inflation over the last couple of years for our industry.
The report doesn’t list reasons so it could be that those growers had already raised prices significantly in previous years. Regardless, it begs the question of the impact of a grower’s cost increases on their profitability.
Let’s look at that relationship.
Impact of Raw Material Cost Increase on Plant Costs
I will analyze a new product we started growing here at our fictitious ‘Johns Plant Farm’. It’s called our Ginormica Bloomicus. One of our leading sellers last year.
Let’s look at our cost for this plant and see what impact these cost increases have.

Example Cost Change Copyright Advanced Grower Solutions
In this table you can see our current costing in the ‘Cost’ Column. We further applied the cost increases reported by the Nursery Management State of the industry report in the ‘Increase’ Column.
Also, for the area where ‘Johns Plant Farm’ is located we are assuming our labor costs will go up 5% and other nursery overhead will go up 3%.
Applying these new cost increases to our ‘Ginormica Bloomicus’ results in adding $0.3042 cents per each, an overall 9.6% increase. Our total cost is going from $7.48 / ea. to $8.20 / ea.
In terms of just basic raw materials, the reported State of the Industry increases resulted in a total increase 18.7% for raw materials costs alone.
With our new projected costs calculated let’s examine the impact on our profitability for ‘Ginormica Bloomicus’.
Impact of Raw Material Cost Increases on Plant Profitability
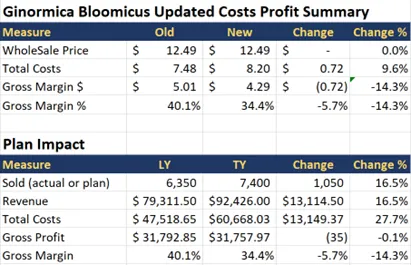
Example Cost Profit Summary Copyright Advanced Grower Solutions
You can see that we have a decent 40% gross margin on our plant.
However, by applying the cost increases our gross margin deteriorates significantly, down 14.3 percent (573 basis points) if we do not change the price we charge.
Further, for this year I was planning on growing more ‘Ginormica’ because the demand in our area has been higher than expected. So, I have added another 1,050 (+16.5%) to our plan but with these cost increases, and no commensurate price increases, I am losing more money. The reason for this is two-fold in this example:

Example Cost change distribution Copyright Advanced Grower Solutions
- Cost increase from raw material increase and other costs we calculated come in at 9.6% as we expect.
- Additional costs relative to last year for this product come from the added production volume. So that is the reason our total costs for the new plan are 27.7% higher than last year.
And that destroys any profits from the added production volume.
Calculating Updated Pricing To Account For Cost Increases
So how do we adjust the price to account for the additional cost?
Let’s assume that ‘Johns Plant Farm’ wants to just maintain the 40% gross margin we had last year.
In order to calculate the new price, we calculate the markup required on the costs to give us back a margin of 40%.
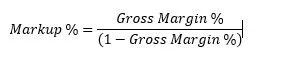
Markup Required* Copyright Advanced Grower Solutions*
So, using this equation, in order to keep our 40% gross margin we need a markup of 66.9% on our costs. Since our new costs total $8.20, then the markup would look like $8.20 * (1+ .669) = $13.68. Thus, the old price of $12.49 needs to be adjusted to $13.68 as shown below.
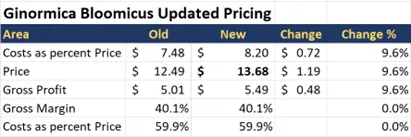
Example Updated Pricing* Copyright Advanced Grower Solutions*
Certainly, cost markup is not the only pricing philosophy a grower can use. However, it is a straight forward one and aligns with how many growers operation their business.
Sales Plan Impact on Price Change
Raising our price $1.19, which equates to a 9.6% increase, restores our gross margin to what it was last year.
What does that do to our plan change for this year?
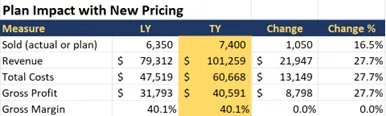
Example Plan Impact* Copyright Advanced Grower Solutions*
These price changes, with our added production get us back to where we want to be in terms of projected gross margin, assuming everything sells through.
Remember that any price change can have an impact on sales volume – lowering prices is generally thought to increase sales while raising prices is thought to decrease sales for the same demand and customer base.
This is where your knowledge of your market, customers and unique value proposition can help ‘educate’ these types of pricing adjustments in a more granular way that simple markup math.
Considerations Before Making Pricing Increases Too Simple
Observant readers will naturally ask, so why go through all this spreadsheet handwaving, why not just raise the prices the same amount as the total costs increased?
That is a good point.
And some growers do that assuming they are happy with their original gross margin.
For simple ‘micro’ pricing scenarios like the one we have analyzed here that is a perfectly fine rule of thumb. Some growers may be fortunate enough to only have to adjust a few SKUs in this simple manner.
However, there are a couple of things to consider before always using the rule of thumb.
- Many growers sell 10’s or hundreds (or thousands) of SKUs so when you extrapolate across a whole sales plan your true operating gross margin is a weighted average of all the ‘micro’ gross margins for each of your plants.
- Secondly, not every grower SKU has the same margin. For those growers that use a ‘square foot weeks’ (or acres or inches) to allocate certain overhead costs in proportion to the time and growing space the plant takes up will have gross margins at the SKU/item level all over the place.
- Not every SKU has a positive gross margin. Yes, its true, some SKUs are sold at a very low or break even or even at a loss (Poinsettia anyone??) to satisfy any number of business or customer needs. The idea being that those low financially performing SKU are offset by good sales in other much more profitable SKUs. And your business benefits from the overall weighted gross margin.
In a future blog post, we will example the weighted method for overall weighted gross margin.
Advanced Grower Solutions has done a variety of costing/pricing analysis for growers. If you have questions or want to discuss your particular costing analysis, please contact us.
** This is a fictitious company with a fictitious plant, but the costs are from a real grower with real world data.